Erin A. Tsai
Data Analyst / Data Scientist

Data Analyst / Data Scientist
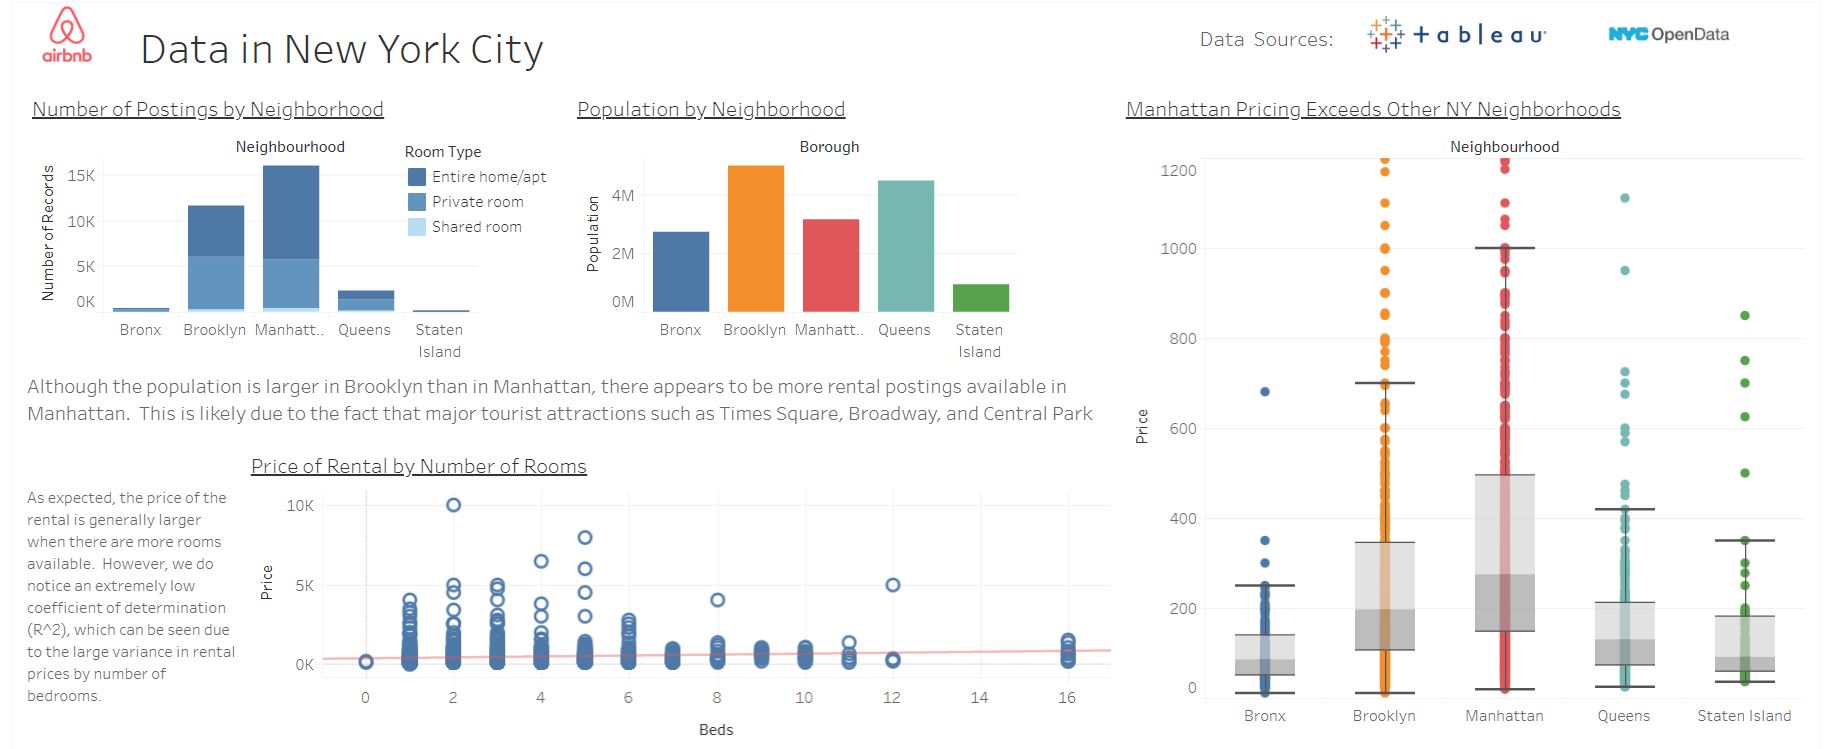
Here are some projects I have completed showcasing my abilities to create dashboards, presentations and conduct data analysis using Python, R, SQL and Excel.
Table of Contents
Dashboards in Tableau
PowerPoint Presentations
Various Papers using Data Analysis and Research
We were asked to compare the two Loan Origination Systems and to provide a report on the results.
Coding Language: Python to conduct analysis
Software Used: Excel for creating a calculated column for days of processing, and to easily filter out unneccessary data
We were asked to present a proposal to shift the company into a different data structure that would break the silos.
We were asked to choose a company to do a case study, identify a problem, and offer solutions. My group chose Hulu to compare to other video streaming services based on the low profit seen in 2019.
Various Papers using Data Analysis and Research
Is a new Mexican border wall really necessary?
We were asked to find data sets to analyze using R. I pulled data from the United States Department of Homeland Security regarding arrests at the Mexican border to analyze President Trump's claim that a Mexican border wall was necessary because of the increasing number of illegal Mexicans criminals entering the United States.
Coding Language: R